
Many commercial properties are priced above fair market value. A few are not, and those are the ones worth finding. The signal usually shows up when you read recent comps and current market trends side by side.
Say the last three retail comps in your target market are more than six months old, and interest rates have dropped twice since. How do you price today’s deals? Comps alone will not tell you. Trends alone will not either. Together, they can show you where an asking price and the market have drifted apart.
What you will learn
- Why comps alone can mislead you, and what to pair them with
- Four market trend metrics that can point to mispriced assets
- How to build a tight, comparable comp set
- A five-step workflow: spot, validate, grade
- Which Crexi tools fit each step, and what you can use on a free account
The short version: undervalued assets often hide in plain sight, and the key is knowing how to read beyond the numbers. Comparing comps with current market trends helps reveal which assets are truly mispriced. A clear, data-driven process gives you more confidence that what you find is a real opportunity.
Along the way, we point to Crexi tools such as Market Reports and Property Records and Comps that make it easier to connect the dots.
Why comps alone fall short
Comps are a critical part of valuing any CRE asset, but they only tell part of the story. Comps show what similar properties have sold or leased for, and they can go stale quickly in a market that shifts month to month. When deal volume slows, comp relevance can drop sharply, and even small property differences can throw off a valuation.
Picture two office buildings that look identical on paper. They can differ in lease terms, tenant credit, or who covered tenant improvements. One might have months of free rent baked in, while the other has years left on a steady NNN lease. Details like $15 PSF in TI allowances, a 6-month rent abatement, or 2% annual escalations sit in the deal terms and are hard to capture from a data point alone. The most reliable way to understand them is to talk with the property managers, tenants, or brokers who know the deal firsthand.
Comps show what happened. Trends help you see what is happening now.
That is why comps should never stand alone. To understand value, pair comparables with live market trends, macro-level data, and property-specific insights. This layered approach gives you the full picture, so you can pinpoint real value and avoid being misled by incomplete numbers.

Four market trends that can point to hidden value
When you are hunting for undervalued assets, current market conditions matter as much as transaction records. Crexi’s commercial real estate trends to watch in 2025 point to big shifts in asset types, financing, and supply and demand. Even slight interest rate cuts hint at shifting conditions, a reminder that pricing dynamics can change quickly.
Track these four metrics:
- Inventory changes. Watch how much new space is coming onto the market, then compare it with how much is being leased or sold. This shows whether supply is growing faster than demand.
- Rent vs. asking-price spread. Check whether rent growth is keeping up with sale prices. If rents are rising but prices are not, that could signal hidden value.
- Days on market. A shorter timeline often means stronger demand, while a longer one can point to overpricing.
- Asking cap rate vs. sale cap rate. Compare what sellers expect with what deals actually close for. A wide gap can reveal either overvalued assets or underpriced opportunities.
When market patterns and comps do not line up, it is often worth a closer look.
Staying tuned to the latest reports and headlines, such as shifts in retail foot traffic or logistics demand, can show where those gaps are forming in real time. For instance, in retail, national vacancy rates have risen slightly while asking rents have stayed strong. That contrast suggests well-located properties may be priced below market value, even as weaker ones struggle.
The same goes for markets where rent growth is climbing but sale prices have not caught up yet. Watching for these gaps can help you find value before the rest of the market catches on.

The comps playbook: what to look for
Precision matters when you value a property with comparables. A solid comp set gives you the clearest picture of what buyers are really paying, and what might be mispriced. But accuracy depends on more than pulling the first few results that look close. You need to look at each property’s fundamentals and context.
Compare these details across every comp
- Transaction date. The market changes fast. Focus on recent sales or leases so your analysis reflects today’s pricing.
- Price per square foot. This helps you benchmark value quickly across similar buildings.
- NOI, cap rate, and operating expenses. These numbers show how efficiently a property performs relative to its peers.
- Asset class, property class (A/B/C), and lease terms. Details like who pays expenses, free rent periods, or tenant improvements can make a big difference.
- Adjustments for differences. Always account for size, location, and age so you are comparing apples to apples.
Keep it hyper-local. Comps are most useful within 1 to 5 square miles, if possible. Instead of relying on broad metro averages, focus on submarkets where rents, demand, and tenant mixes behave more consistently. Even being on the other side of the street can affect valuation.
Crexi’s Property Records and Sales Comps tool helps you do this faster. It brings ownership details, transaction history, and market insights together in one view, so you can see how assets stack up side by side. From there, you can export or refine your list to match the parameters that matter most to your deal.
Once you have built your foundation, Crexi Vault can take your analysis further. Vault lets you upload offering memorandums, rent rolls, and lease abstracts, then automatically extracts key data points, from cap rates to occupancy. The result is a searchable archive you can cross-reference against recent deals and property records, which turns static documents into usable insight.
Red flags and contrarian cues
Spotting an undervalued property often means paying attention to details that never show up in a data sheet or comp report. Sometimes the signs are small: an outdated sign, a tired building, or an owner ready to move on.
- Frequent price drops or repeated listings. These can be early hints that a seller is losing confidence or motivation.
- A long time on market. A property that sits, even with strong fundamentals like good tenants or location, can be a sign of hidden value.
- Asking prices above recent sales. If similar properties are closing for less, there may be room to negotiate.
- Negative sentiment, stable metrics. If the mood feels gloomy but local metrics such as rent growth or occupancy look stable, the numbers may tell a different story.
Layer your filters to dig deeper
- Start with ownership records to see who owns the property and how long they have held it.
- Add lease expiration data to find buildings that may soon have vacancies. Owners in that position might be more willing to sell or renegotiate.
- Include pre-foreclosure or CMBS data to spot financial stress that could motivate a sale.
Combining these filters helps you focus on properties that are more likely to be below market value or ready to change hands.

A five-step workflow: spot, validate, grade
Finding an undervalued property takes a mix of insight and process. Here is a simple workflow to follow.
- Identify strong markets. Start with Market Reports to see where trends are shifting. Look at asking vs. sale cap rates, absorption, and inventory changes to spot areas showing early signs of value.
- Pull comps and property records. Search and export recent comps in your target market using Crexi. Compare sale prices, lease terms, and ownership details to understand the local baseline.
- Layer in trend data. Add rent growth, vacancy, and supply data to see where comparables may lag behind current market conditions. This helps you find places where values have not yet caught up to performance.
- Adjust and test. Account for differences in property size, age, or location. Then run quick sensitivity checks to see how interest rate or rent changes could affect returns.
- Grade your opportunities. Rank each asset by potential upside versus risk. Focus on the ones that show a healthy spread compared with their peers.
Build your watchlist while you research
Save a search for your target market, and Crexi will email you when new listings match. It is a simple way to keep fresh candidates flowing into steps 2 through 5. Saved searches are available from your account dashboard.
Where demographics drive CRE growth
When traffic, population, and income trends line up, they can reveal markets with real staying power. Here are two cities where strong demographic signals are helping drive CRE growth.
Detroit, Michigan
Detroit is growing again for the first time in decades. The economy is expanding into healthcare, finance, and tech, and the cost of living is below the national average. As a result, the city appeals to both residents and investors looking for long-term value.
- $18Median asking rental rate per square foot, annually
- 7.4%Median asking cap rate
- 10.6%Median sold cap rate, past 12 months
- 11%Household income growth rate
New Orleans, Louisiana
A cultural landmark and major Gulf port, New Orleans continues to rebuild and grow. The population is growing and the median income is rising. There are also new investments in healthcare and infrastructure, and the city is seeing renewed activity in its business districts.
- $20Median asking rental rate per square foot, annually
- 7.5%Median asking cap rate
- 7.1%Median sold cap rate, past 12 months
- 21%Household income growth rate
What to notice: A sold cap rate above the asking cap rate means deals closed at lower prices than sellers’ asking figures implied. In Detroit, that gap is wide. In New Orleans, the two numbers sit much closer together. That is the kind of spread worth investigating with comps.
Putting it to work with Crexi
Crexi brings what you need to evaluate commercial real estate into one platform, so you can move faster and decide with more confidence. Here is how the tools line up with the workflow above, and what you can use on a free account today versus what comes with an upgrade.
On your free account
- Listing search. Search sale and lease listings on Crexi’s open marketplace.
- Saved searches and alerts. Save your target-market searches and get email alerts when new listings match, so you can act before the competition does.
With PRO or Intelligence
- Property Records and Sales Comps. View ownership information, past transactions, and comps side by side, then filter and export comp sets for deeper analysis or team sharing.
- Market Reports. Track asking vs. sale cap rates, inventory shifts, and absorption trends to find markets with upside potential.
- Saved comp searches and alerts. An Intelligence feature. Save your favorite comp searches and get alerts when new, relevant deals appear.
Plan inclusions can change. See the Crexi PRO help article and the Crexi Intelligence page for current details.
Two scenarios: what this looks like in practice
Seeing the strategy in action makes it easier to apply. Here are two quick, illustrative examples of how investors can use this approach to uncover off-the-radar assets.
Scenario 1: a retail center with rising rents
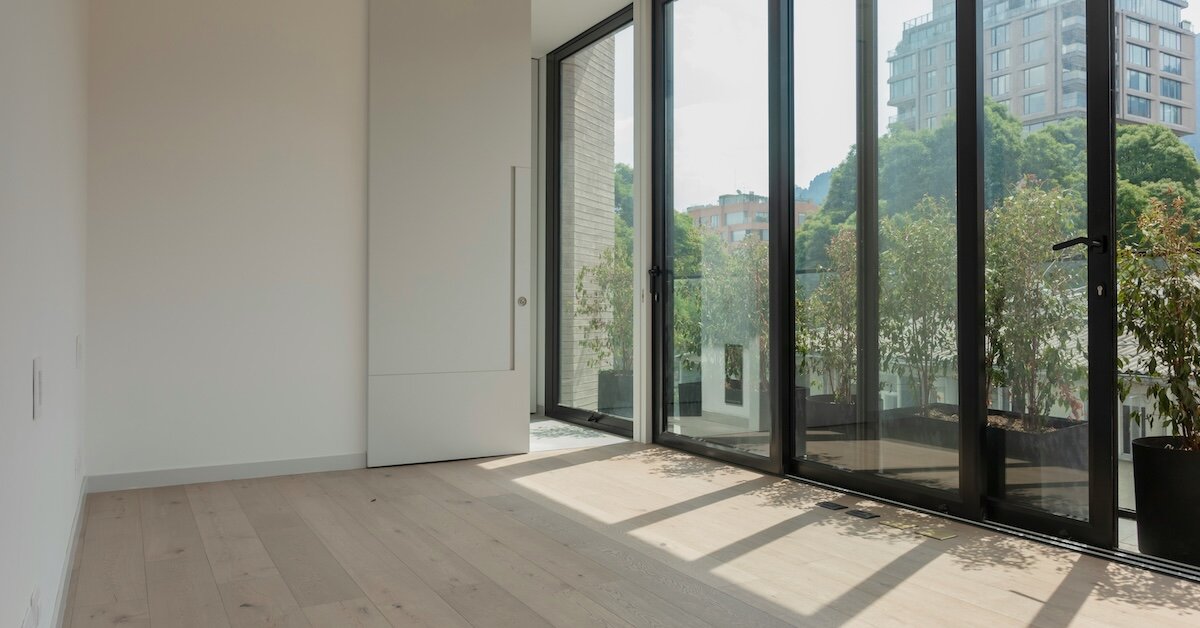
An investor spots a small neighborhood retail center listed below recent sale prices. At first glance, the comps suggest it is fairly priced. But when the investor reviews local trend data, they see rent growth climbing and vacancy dropping faster than recent sales reflect. The property’s income potential is higher than it appears, and the investor secures it before values adjust.
Scenario 2: an industrial warehouse with untapped value
A broker reviews comps on an older warehouse that has been sitting on the market for months. Vacancy in the submarket is tightening, and new construction has slowed. After checking Crexi’s Market Reports, the broker sees asking rates rising nearby. With some light updates, the warehouse could command higher rents, which would make it an undervalued CRE property.
The bottom line
High-value opportunities still exist. They just take sharper tools and a closer look to find. When the market story does not match the numbers, that is often where real value hides. By tapping into recent sales, property records, and market data, you can uncover deals others might miss.
Crexi’s Market Reports and unified Comps and Records tools make it simple to start your own search. Explore insights, test your assumptions, and see where the numbers point. Your next great investment might already be waiting.
Take the next step with Crexi
Your free account is a good place to start. Save a search for your target market and get email alerts when new listings match. When you are ready to work with sales comps, property records, and Market Reports, explore Crexi Intelligence or PRO to see which plan fits how you invest.
Plan features vary. Review what each plan includes before you upgrade.